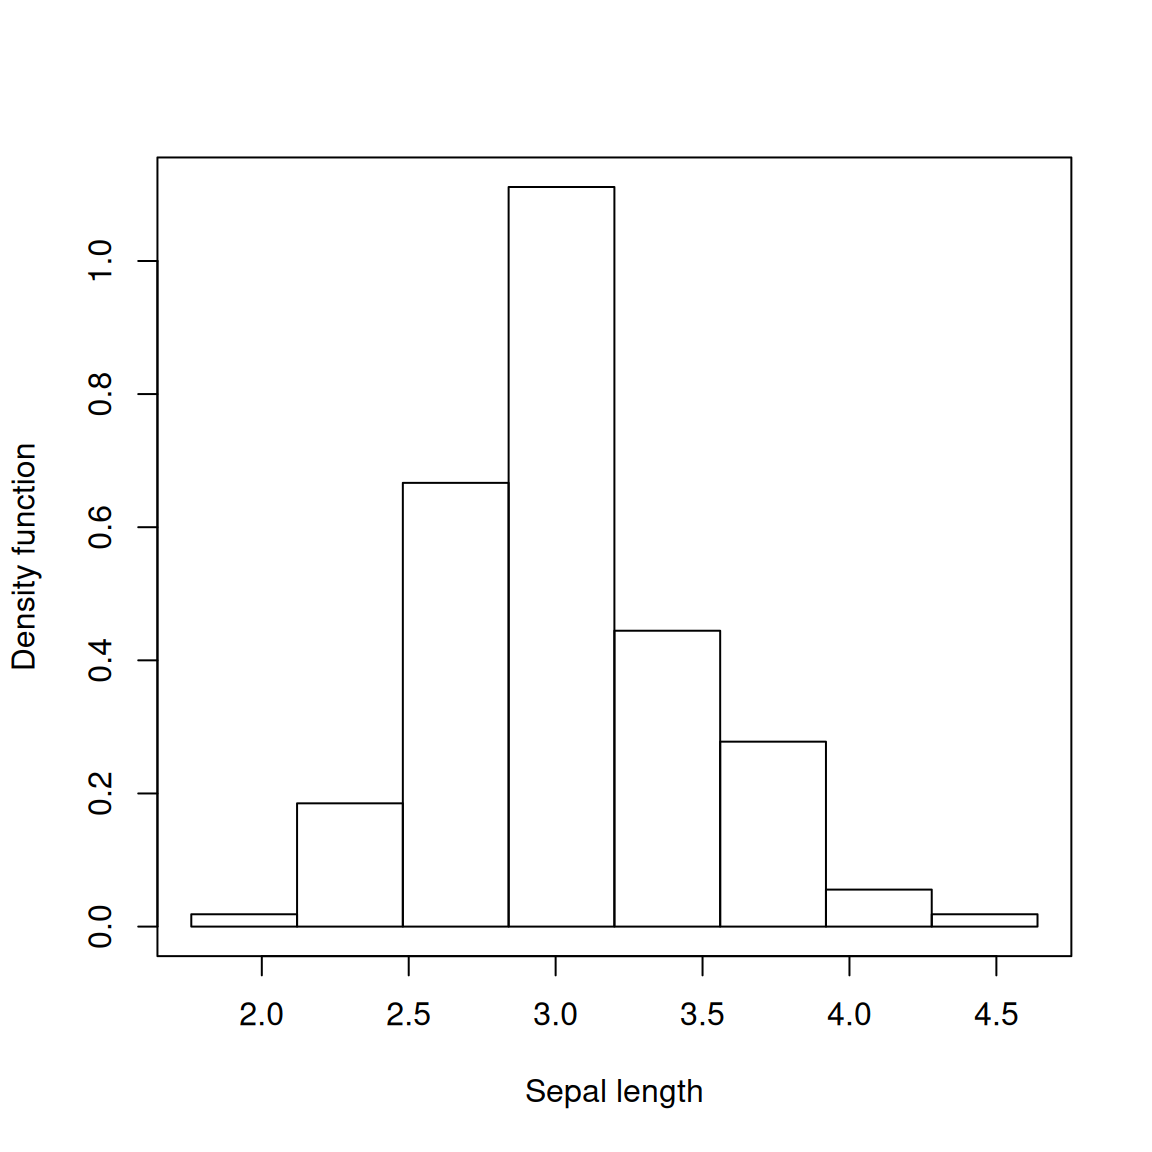
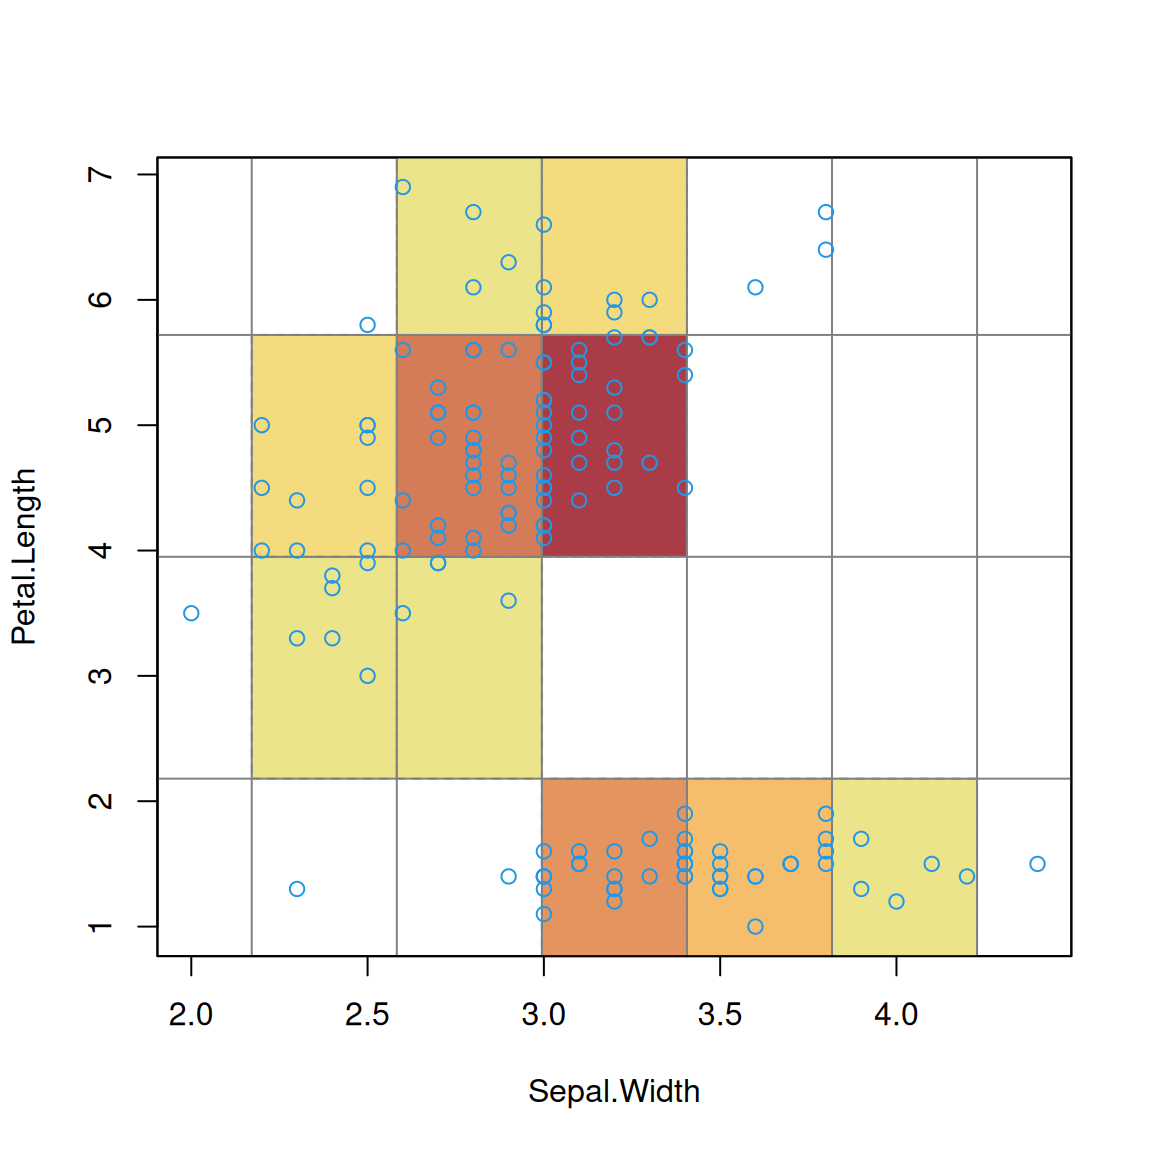
Plot for histogram density estimate
plot.histde.RdPlot for histogram density estimate for 1- and 2-dimensional data.
Usage
# S3 method for class 'histde'
plot(x, ...)
Arguments
- x
object of class
histde(output fromhistde)- ...
other graphics parameters:
colplotting colour for density estimate
col.funplotting colour function for levels
col.ptplotting colour for data points
jitterflag to jitter rug plot (1-d). Default is TRUE.
xlim,ylimaxes limits
xlab,ylabaxes labels
addflag to add to current plot. Default is FALSE.
drawpointsflag to draw data points on density estimate. Default is FALSE.
breaksvector of break values of density estimate. Default is an
nbreaksequilinear sequence over the data range.nbreaksnumber of breaks in
breakssequencelty.rect,lwd.rectline type/width for histogram box lines (2-d)
bordercolour of histogram box lines (2-d)
col.rectcolour of histogram bars (1-d)
add.gridflag to add histogram grid (2-d). Default is TRUE.
Details
For histde objects, the function headers for the different dimensional data are
  ## univariate
  plot(fhat, xlab, ylab="Density function", add=FALSE, drawpoints=FALSE,
     col.pt=4, jitter=FALSE, border=1, alpha=1, ...)

  ## bivariate
  plot(fhat, breaks, nbreaks=11, xlab, ylab, zlab="Density function", cex=1,
     pch=1, add=FALSE, drawpoints=FALSE, col, col.fun, alpha=1, col.pt=4,
     lty.rect=2, cex.text=1, border, lwd.rect=1, col.rect="transparent",
     add.grid=TRUE, ...)
The 1-d plot is a standard plot of a histogram generated by hist. If
drawpoints=TRUE then a rug plot is added.
The 2-d plot is similar to the display="filled.contour" option from
plot.kde with the default nbreaks=11 contour
levels.