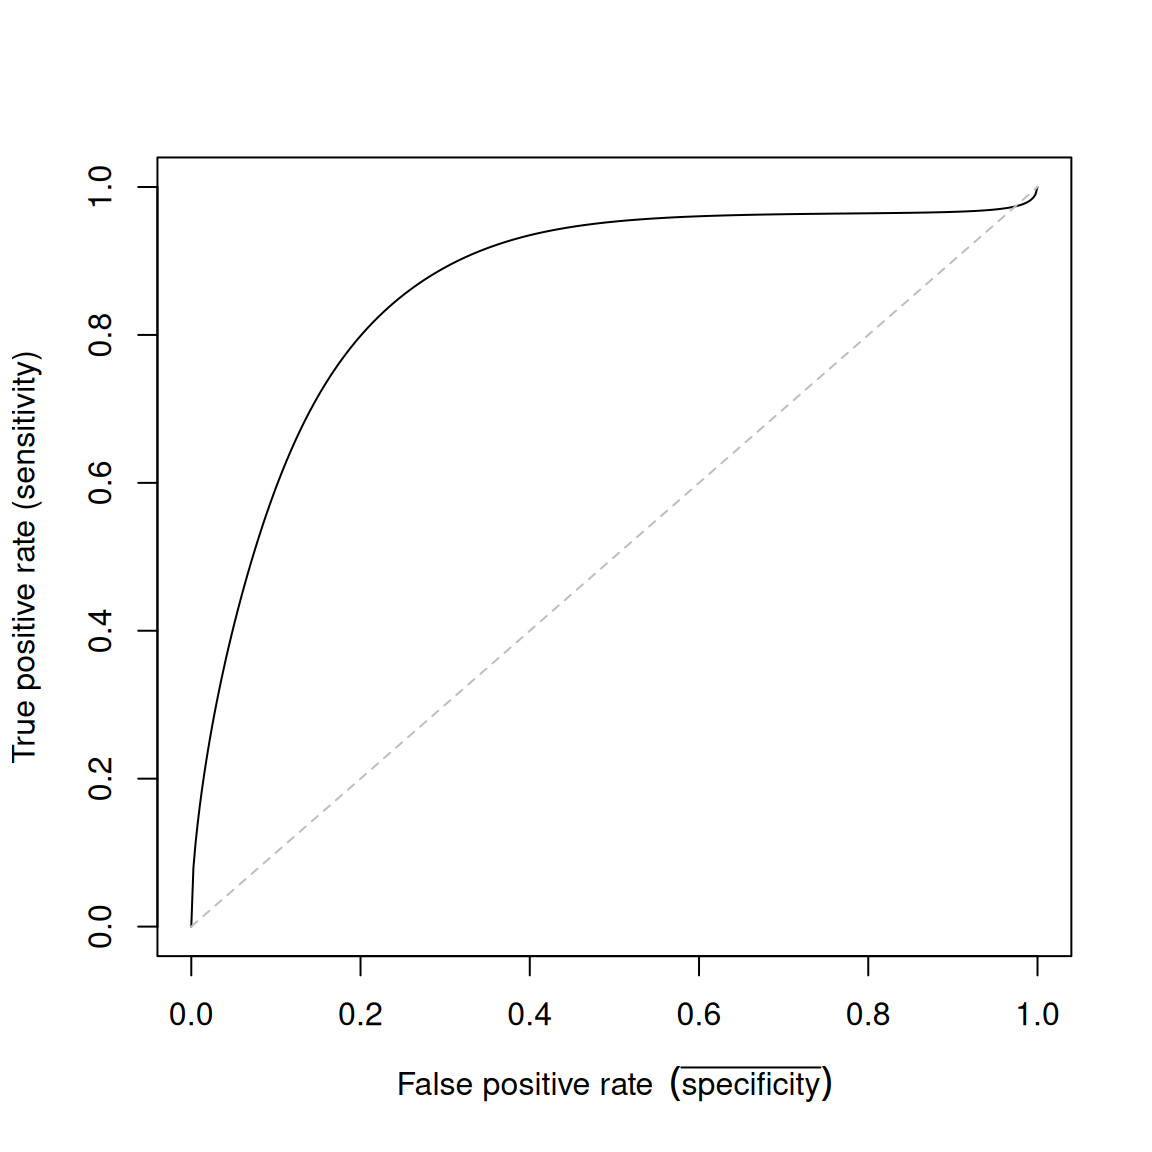
Plot for kernel receiver operating characteristic curve (ROC) estimate
plot.kroc.RdPlot for kernel receiver operating characteristic curve (ROC) estimate 1- to 3-dimensional data.
Usage
# S3 method for class 'kroc'
plot(x, add=FALSE, add.roc.ref=FALSE, xlab, ylab,
   alpha=1, col=1, ...)
Arguments
- x
object of class
kroc(output fromkroc)- add
flag to add to current plot. Default is FALSE.
- add.roc.ref
flag to add reference ROC curve. Default is FALSE.
- xlab
x-axis label. Default is "False positive rate (bar(specificity))".
- ylab
y-axis label. Default is "True positive rate (sensitivity)".
- alpha,col
transparency value and colour of line
- ...
other graphics parameters used in
plot.kde.
Value
Plots for 1-d and 2-d are sent to graphics window. Plot for 3-d is sent to graphics/RGL window.