Variable kernel density estimate.
vkde.RdVariable kernel density estimate for 2-dimensional data.
Usage
kde.balloon(x, H, h, gridsize, gridtype, xmin, xmax, supp=3.7, eval.points,
   binned, bgridsize, w, compute.cont=TRUE, approx.cont=TRUE, verbose=FALSE)
kde.sp(x, H, h, gridsize, gridtype, xmin, xmax, supp=3.7, eval.points,
   binned, bgridsize, w, compute.cont=TRUE, approx.cont=TRUE, verbose=FALSE)
Arguments
- x
matrix of data values
- H
bandwidth matrix. If this missing,
Hnsis called by default.- h
not yet implemented
- gridsize
vector of number of grid points
- gridtype
not yet implemented
- xmin,xmax
vector of minimum/maximum values for grid
- supp
effective support for standard normal
- eval.points
vector or matrix of points at which estimate is evaluated
- binned
flag for binned estimation.
- bgridsize
vector of binning grid sizes
- w
vector of weights. Default is a vector of all ones.
- compute.cont
flag for computing 1% to 99% probability contour levels. Default is TRUE.
- approx.cont
flag for computing approximate probability contour levels. Default is TRUE.
- verbose
flag to print out progress information. Default is FALSE.
Details
The balloon density estimate kde.balloon employs bandwidths
which vary at each
estimation point (Loftsgaarden & Quesenberry, 1965). There are as many bandwidths as there are estimation
grid points. The default bandwidth is Hns(deriv.order=2) and
the subsequent bandwidths are derived via a minimal MSE formula.
The sample point density estimate kde.sp employs bandwidths
which vary for each data point (Abramson, 1982).
There are as many bandwidths as there are data
points. The default bandwidth is Hns(deriv.order=4) and the
subsequent bandwidths are derived via the Abramson formula.
References
Abramson, I. S. (1982) On bandwidth variation in kernel estimates - a square root law. Annals of Statistics 10, 1217–1223.
Loftsgaarden, D. O. & Quesenberry, C. P. (1965) A nonparametric estimate of a multivariate density function. Annals of Mathematical Statistics 36, 1049–1051.
Examples
data(worldbank)
wb <- as.matrix(na.omit(worldbank[,4:5]))
xmin <- c(-70,-35); xmax <- c(35,70)
fhat <- kde(x=wb, xmin=xmin, xmax=xmax)
fhat.sp <- kde.sp(x=wb, xmin=xmin, xmax=xmax)
zmax <- max(fhat.sp$estimate)
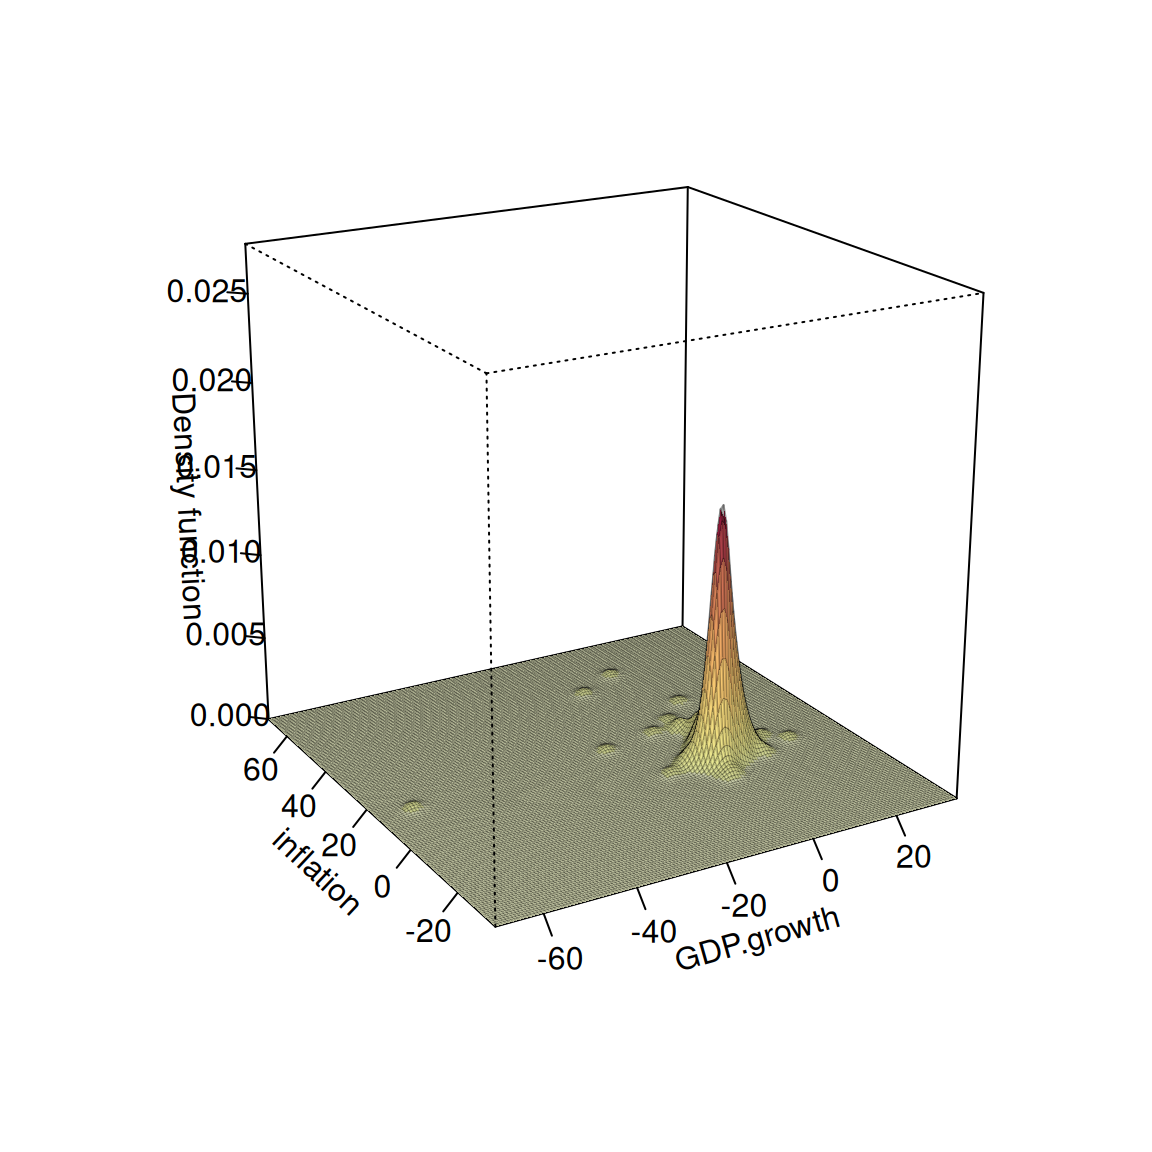
plot(fhat, display="persp", box=TRUE, phi=20, thin=1, border=grey(0,0.2), zlim=c(0,zmax))
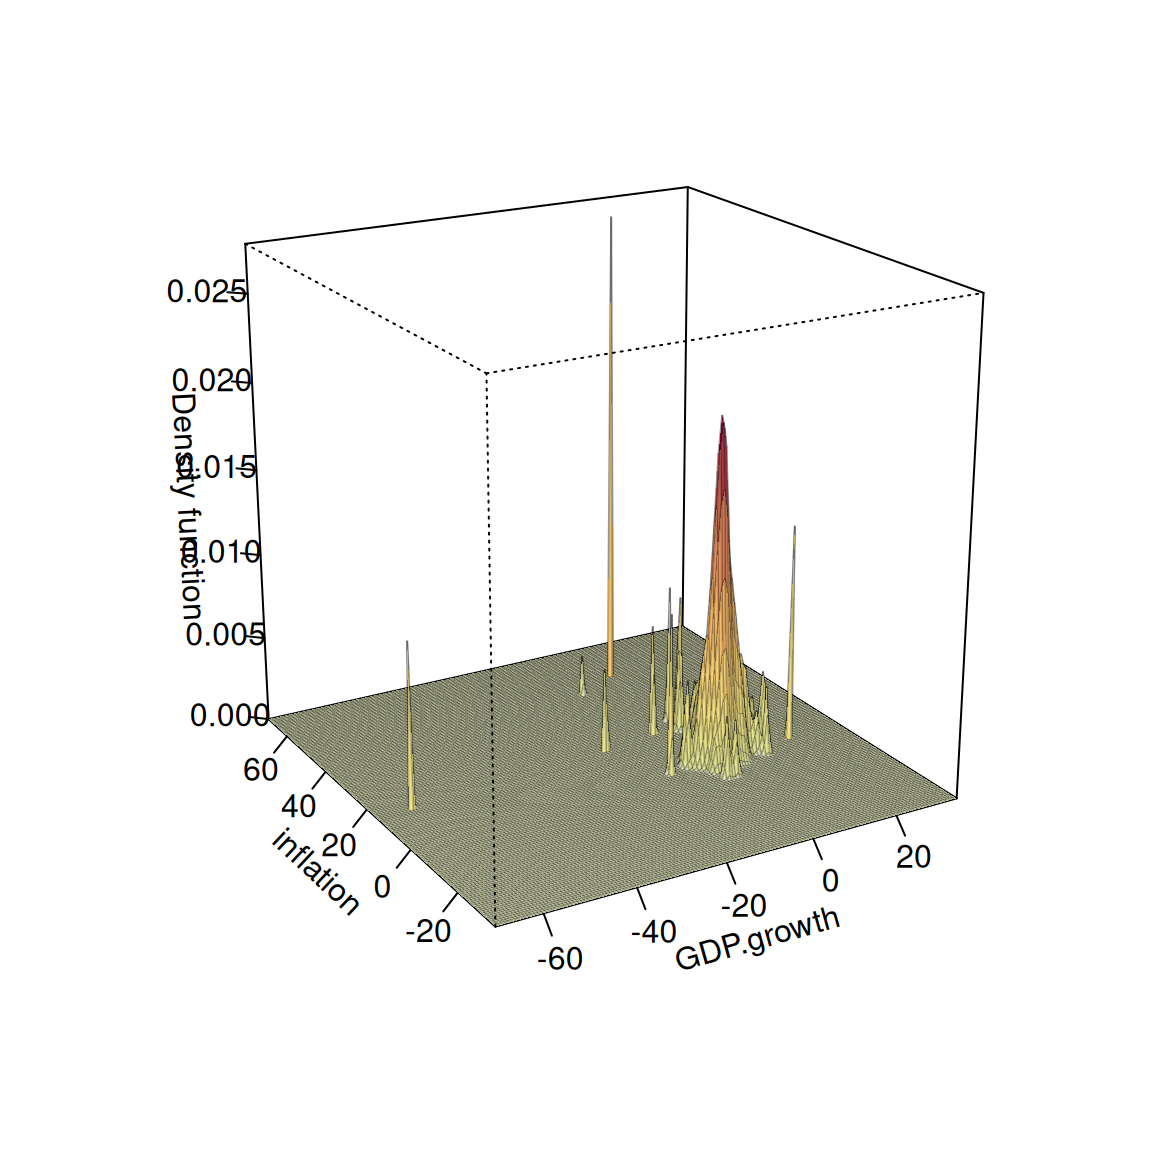
 plot(fhat.sp, display="persp", box=TRUE, phi=20, thin=1, border=grey(0,0.2), zlim=c(0,zmax))
 if (FALSE) { # \dontrun{
fhat.ball <- kde.balloon(x=wb, xmin=xmin, xmax=xmax)
plot(fhat.ball, display="persp", box=TRUE, phi=20, zlim=c(0,zmax))} # }
if (FALSE) { # \dontrun{
fhat.ball <- kde.balloon(x=wb, xmin=xmin, xmax=xmax)
plot(fhat.ball, display="persp", box=TRUE, phi=20, zlim=c(0,zmax))} # }