Contour and filled contour plots for tidy kernel estimates
geom_contour_ks.RdContour and filled contour plots for tidy kernel estimates for 2-dimensional data.
Usage
geom_contour_ks(mapping=NULL, data=NULL, stat="contour_ks",
    position="identity", ..., cont=c(25,50,75), contperc=TRUE,
    breaks=NULL, digits=NULL, show.legend=NA, inherit.aes=TRUE)
stat_contour_ks(mapping=NULL, data=NULL, geom="contour_ks",
    position="identity", ..., show.legend=NA, inherit.aes=TRUE)
geom_contour_filled_ks(mapping=NULL, data=NULL, stat="contour_filled_ks",
    position="identity", ..., cont=c(25,50,75), contperc=TRUE,
    breaks=NULL, transp_neutral=NULL, digits=NULL, show.legend=NA,
    inherit.aes=TRUE)
stat_contour_filled_ks(mapping=NULL, data=NULL, geom="contour_filled_ks",
    position="identity", ..., show.legend=NA, inherit.aes=TRUE)
Arguments
- mapping
Set of aesthetic mappings created by
aes(). If specified andinherit.aes = TRUE(the default), it is combined with the default mapping at the top level of the plot. You must supplymappingif there is no plot mapping.- data
The data to be displayed in this layer. There are three options:
If
NULL, the default, the data is inherited from the plot data as specified in the call toggplot().A
data.frame, or other object, will override the plot data. All objects will be fortified to produce a data frame. Seefortify()for which variables will be created.A
functionwill be called with a single argument, the plot data. The return value must be adata.frame, and will be used as the layer data. Afunctioncan be created from aformula(e.g.~ head(.x, 10)).- stat
The statistical transformation to use on the data for this layer, as a string.
- position
Position adjustment, either as a string, or the result of a call to a position adjustment function.
- ...
Other arguments passed on to
layer(). These are often aesthetics, used to set an aesthetic to a fixed value, likecolour="red"orsize=3. They may also be parameters to the paired geom/stat.- cont
Vector of contour probabilities. Default value is
c(25,50,75).- contperc
Deprecated.
- transp_neutral
Flag to set neutral colour in diverging fill scale to be transparent.
- breaks
Numeric vector to set the contour breaks e.g. output from
contour_breaks. Overridescont.- digits
Number of significant digits in legend keys. Default is 4.
- show.legend
logical. Should this layer be included in the legends?
NA, the default, includes if any aesthetics are mapped.FALSEnever includes, andTRUEalways includes. It can also be a named logical vector to finely select the aesthetics to display.- inherit.aes
If
FALSE, overrides the default aesthetics, rather than combining with them. This is most useful for helper functions that define both data and aesthetics and shouldn't inherit behaviour from the default plot specification, e.g.borders().- geom
The geometric object to use display the data.
Value
Similar output as the standard layer functions ggplot2::geom_contour, geom_contour_filled and ggplot2::stat_contour, stat_contour_filled.
Details
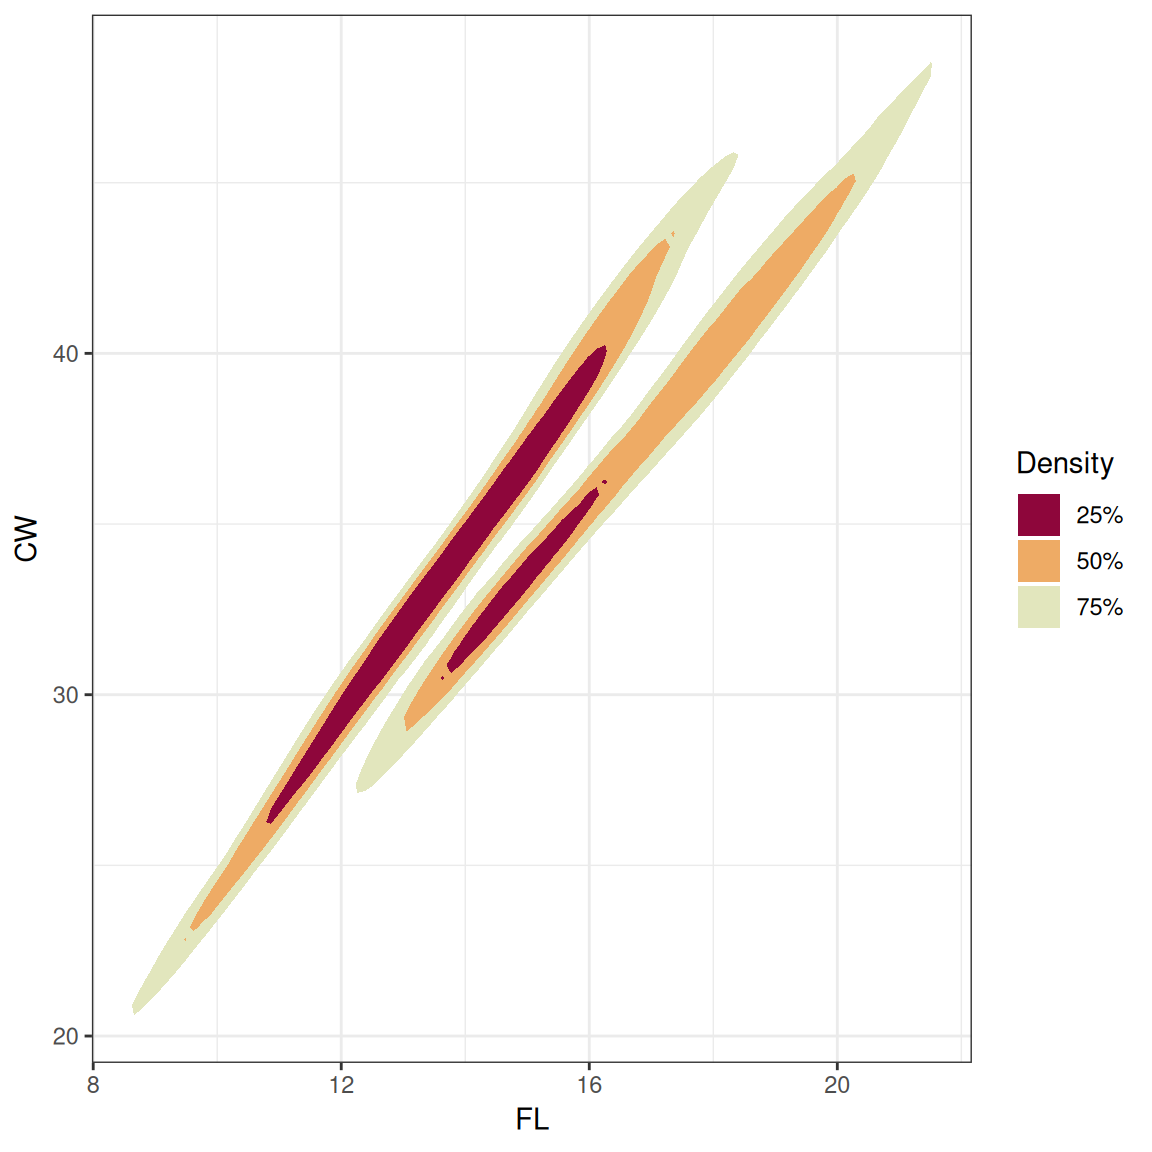
These layer functions are modifications of the standard layer functions ggplot2::geom_contour, geom_contour_filled and ggplot2::stat_contour, stat_contour_filled. Their usage and output are similar, except that they require a tidy kernel estimate as the input, rather than the observations themselves, and that the underlying choice of the contour levels is different. For most cases, geom_contour_ks is equivalent to geom_contour(stat="contour_ks"), and likewise for geom_contour_filled_ks.
The choice of the contour levels are based on probability contours. A 25%
contour region is the smallest region that contains 25% of the
probability mass defined by the kernel estimate. Probability contours offer a more intuitive approach to selecting the contour levels that reveal the pertinent characteristics of the kernel estimates. See Chacon & Duong (2018, Chapter 2.2). They are specified by the cont parameter: the default value is cont=c(25,50,75), which computes the upper quartile, median and lower quartile probability contours. To display legend labels with the percent symbol, contperc=TRUE is deprecated. The preferred syntax is after_stat(contperc) in the aesthetic, though for geom_contour_filled_ks, it is already the default, and can be omitted. See examples below.
Since these probability contours are computed for each group of the grouping variable in data, then these relative contour levels are different for each group. To produce a contour plot with fixed contour levels across all groups, then these can be supplied in breaks: a possible choice is provided by contour_breaks.