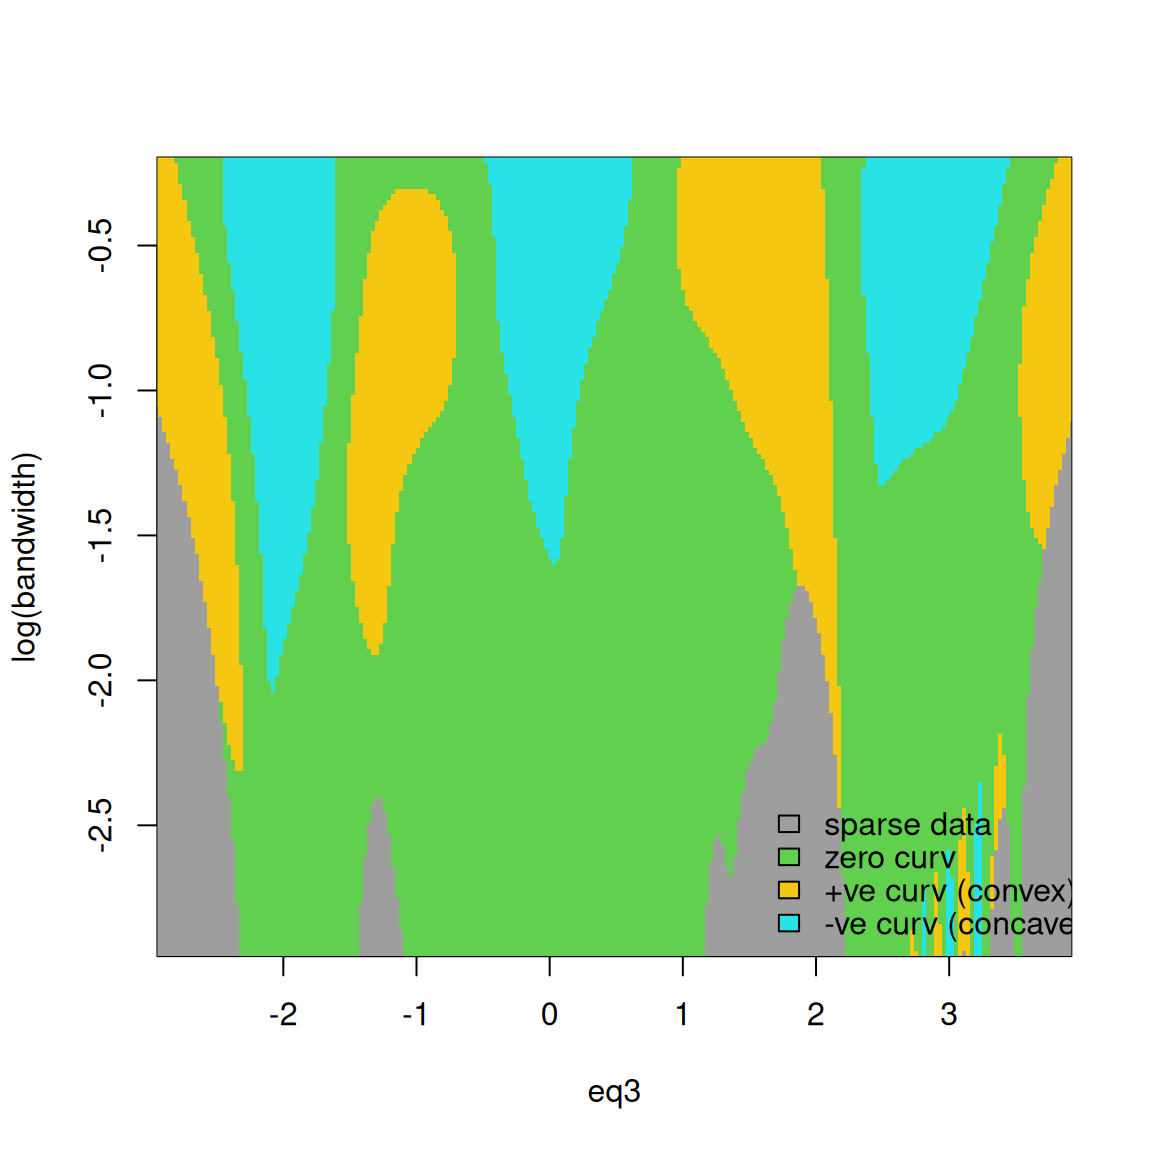
SiZer and SiCon plots for 1-dimensional data
SiZer.RdSiZer (Significant Zero crossings) and SiCon (Significant Convexity) plots for 1-dimensional data.
Usage
SiZer(x, bw, gridsize, scaleData=FALSE, signifLevel=0.05, plotSiZer=TRUE,
   logbw=TRUE, xlim, xlab, addLegend=TRUE, posLegend="bottomright")

SiCon(x, bw, gridsize, scaleData=FALSE, signifLevel=0.05, plotSiCon=TRUE,
   logbw=TRUE, xlim, xlab, addLegend=TRUE, posLegend="bottomright")
Arguments
- x
data vector
- bw
vector of range of bandwidths
- gridsize
number of x- and y-axis grid points
- scaleData
flag for scaling the data i.e. transforming to unit variance for each dimension.
- signifLevel
significance level
- plotSiZer,plotSiCon
flag for displaying SiZer/SiCon map
- logbw
flag for displaying log bandwidths on y-axis
- xlim
x-axis limits
- xlab
x-axis label
- addLegend
flag for legend display
- posLegend
legend position
Details
The gradient SiZer and curvature SiCon maps of Chaudhuri & Marron (1999) are implemented. The horizontal axis is the data axis, the vertical axis are the bandwidths. The colour scheme for the SiZer map is red: negative gradient, blue: positive gradient, purple: zero gradient and grey: sparse regions. For the SiCon map, orange: negative curvature (concave), blue: positive curvature (convex), green: zero curvature and grey: sparse regions.